
SLAC research explores nature on all scales, from the unseen realms of fundamental particles and unbelievably fast processes to astrophysical phenomena of cosmic dimensions that unfold over the age of the universe. Our research opens new windows to the natural world and builds a brighter future through discovery and innovation.
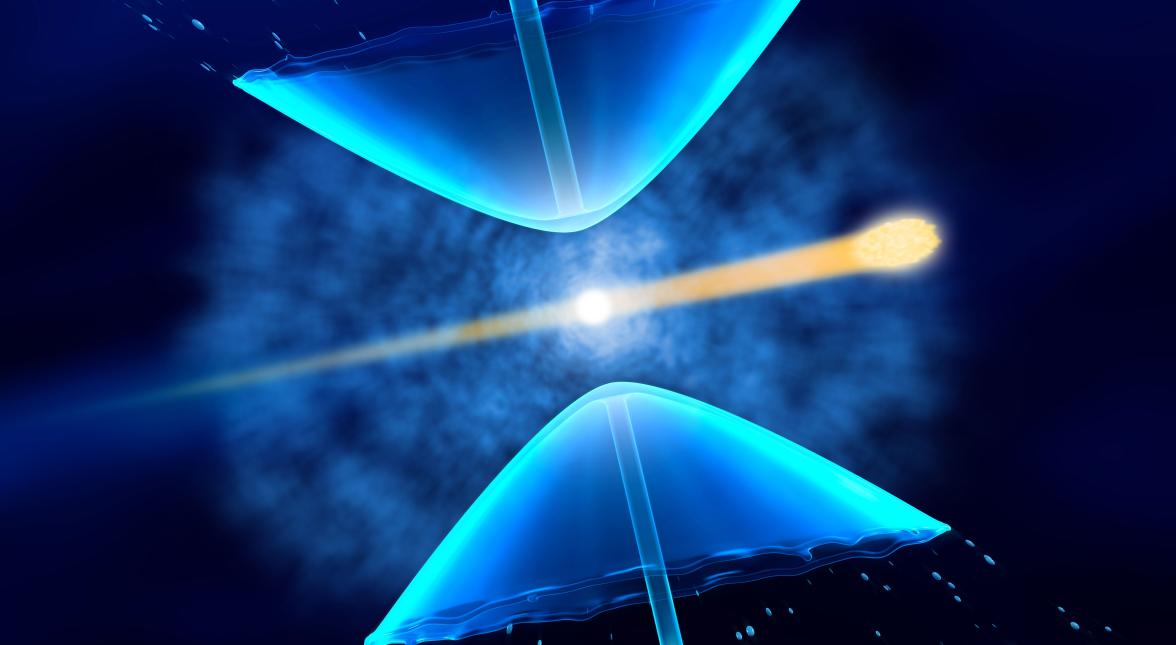
Researchers have made the first microscopic movies of liquids getting vaporized by the world's brightest X-ray laser.
(Greg Stewart/SLAC National Accelerator Laboratory)
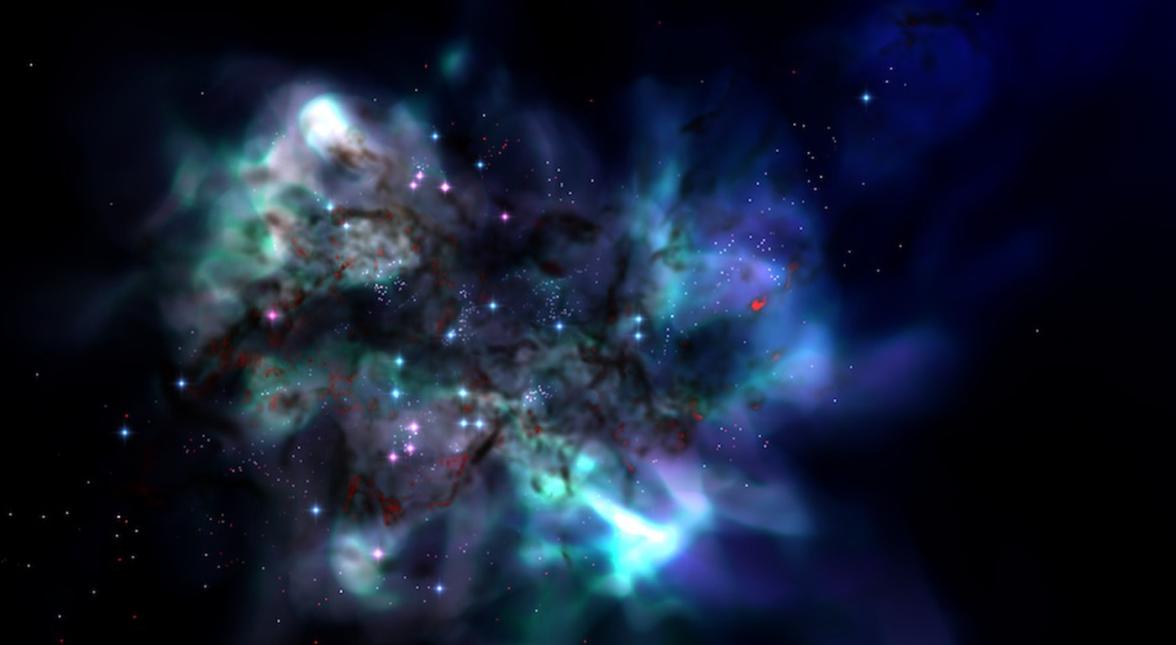
Dwarf Galaxy 3
(Visualization: Ralf Kaehler, Tom Abel Simulation: John Wise, Tom Abel)
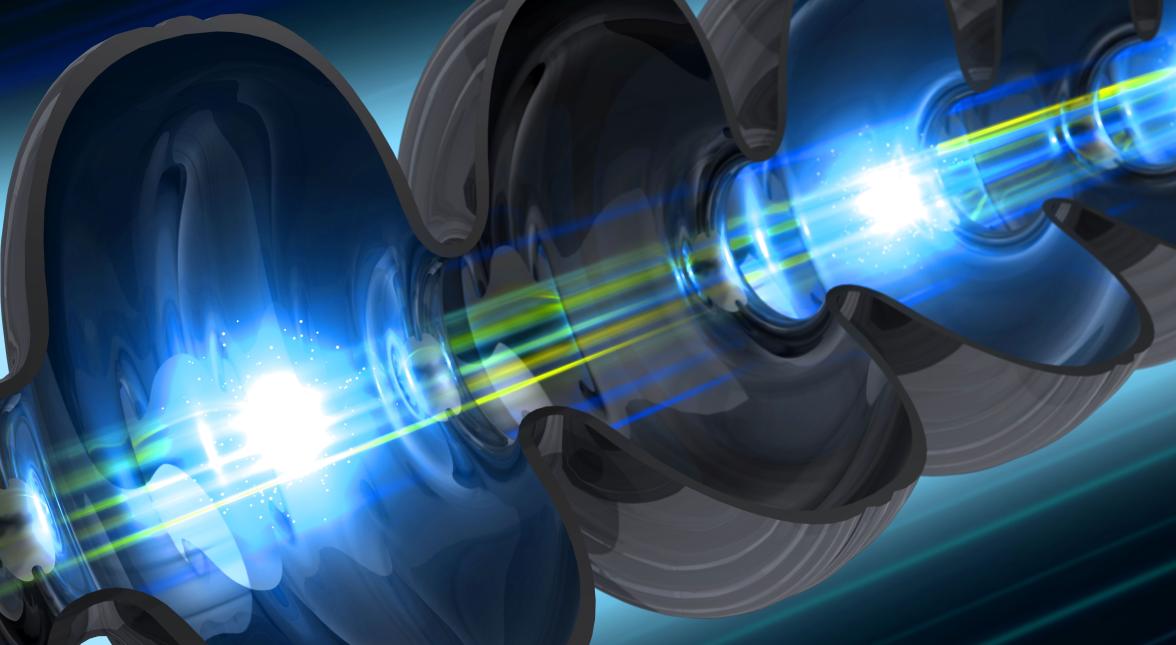
An electron beam travels through a niobium cavity – a key component of SLAC’s LCLS-II X-ray laser.
(Greg Stewart/SLAC National Accelerator Laboratory)

Identifying each tiny chemical step in photosynthesis could aid the development of renewable energy technology.
(Greg Stewart/SLAC National Accelerator Laboratory)
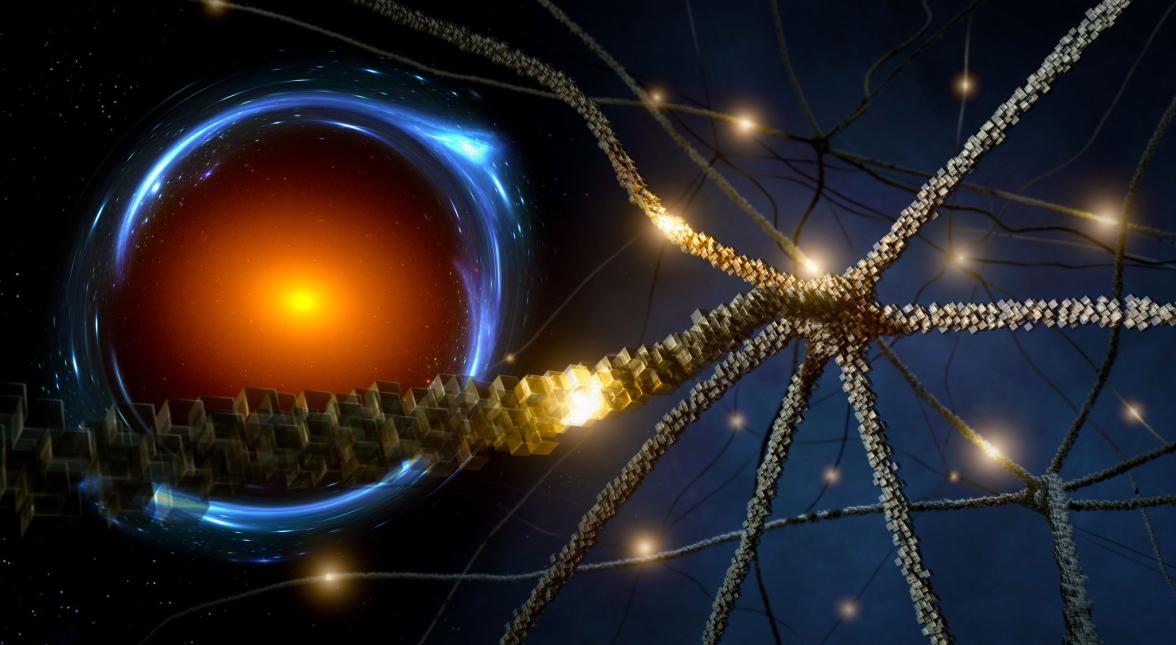
SLAC and Stanford scientists use artificial neural networks to analyze complex distortions in spacetime.
(SLAC National Accelerator Laboratory)
Nanocrystals assemble themselves into a ‘superlattice,” a process that could create complex structures with many uses.
(Greg Stewart/SLAC National Accelerator Laboratory)
dig deeper
Related links
The Basics
SLAC science explained
Learn more about SLAC science with these explainer articles, videos and visuals.

Where Research Happens
SLAC facilities & centers
Learn more about the places where science happens at SLAC: our major facilities, institutes and centers.

Join our mission
Partner with us
Our partnerships with the DOE, Stanford University and industry are vital to our mission and to the growth and direction of our research programs.
